

Quick Analysis of Natural Disaster Impacts Over the Past Five Years
A great deal has happened in the world over the past five years. In the history of the Earth, it is barely a blink of an eye. However, for human life-spans, five years is a significant amount of time. In terms of disaster statistics, we usually see comparisons of data spanning ten to one hundred years. With this analysis, let’s take a peek at the data from the past few years to see what it illuminates. Naturally, we are looking at data from 2013 – 2018 as we are still early in the year.
The most frequently occurring natural disasters are floods, earthquakes, cyclones, and famine. These events cause thousands of deaths, injuries, and incur billions of dollars in economic losses annually. Despite the billions of dollars in humanitarian aid, emergency loans, donations, and other resource support provided many areas of the world still suffer the devastating effects of disasters. In general, global statistics point to a higher frequency of impact on developing nations versus the industrialized countries. Data like this can help us to understand where to target problem-solving and innovation while addressing the needs across the world.
I’m not a scientist or data analyst, but valuable data can be put into practice by disaster professionals. Even short-term data can be insightful. So, let’s see what the data tells us.
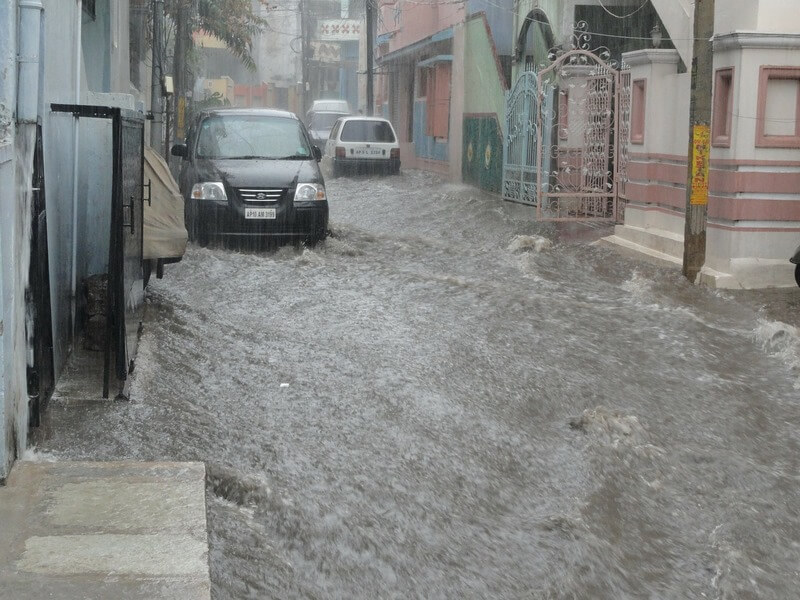
Flooding
It should be no surprise that there were more flooding events over the past five years than any other natural disasters. Flooding is the most common natural disaster event. It consistently tops the list of incidents by volume each year.
A report published by the UN in 2016 stated that floods affected 2.3 billion people and killed 157,000 from 1995 to 2015. Another study by the European Environment Agency in the same year warned that if this trend continues flood events are expected to increase 17 times the current average by 2080 in Europe alone. As another example, in Brazil it was reported just this month that three months of rain fell on Rio De Janeiro in 24 hours, causing ten deaths (source, Floodlist.com). Reports like highlight the impact floods can have on populations across the globe.
Over the past five years, there were 138 floods on average annually across our planet. Last year saw the lowest number of flood incidents, with 109 recorded a high of 161 in 2016.
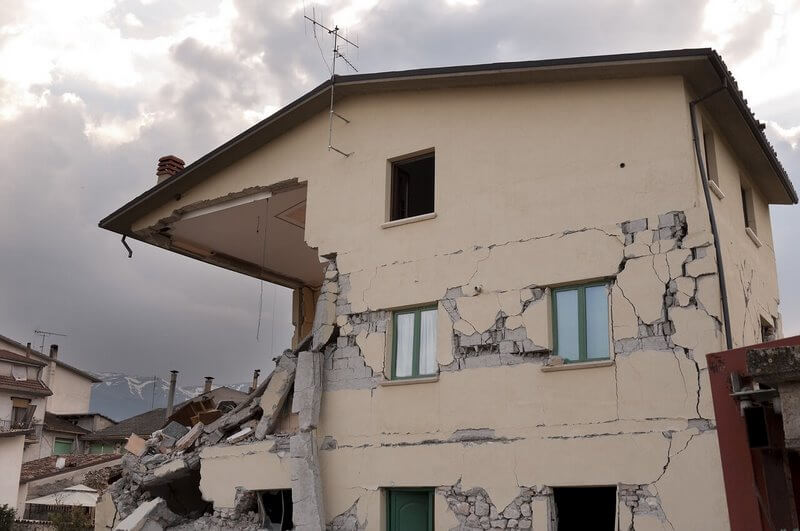
Earthquakes
Did you know volcanic eruptions and meteor impacts can cause earthquakes? This fact is pretty amazing, but the majority of earthquakes happen because of the movement of the earth’s plates. The largest recorded earthquake in the world was a magnitude 9.5 (Mw) in Chile on May 22, 1960. The world’s deadliest recorded earthquake occurred in 1556 in central China. It struck a region where most people lived in caves carved from soft rock. These dwellings collapsed during the quake, killing an estimated 830,000 people. In 1976 another deadly earthquake struck in Tangshan, China, where more than 250,000 people were killed (source USGS).
It’s incredible to think that the earth’s 20 plates are constantly shifting. The National Earthquake Information Center (NEIC) records an average of 20,000 earthquakes every year (about 50 a day) around the world. Of these, it’s not the movement caused by the earthquakes that cause deaths annually but the damage to buildings along with the associated fires, landslides, and tsunamis triggered by them. Usually, the areas of the globe that are most at risk for earthquakes are locations adjacent to the tectonic plates.
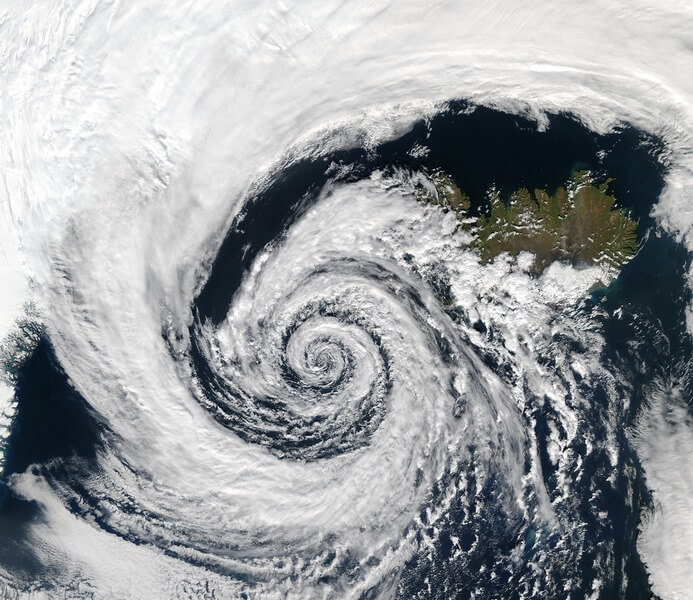
Cyclones
This category also includes hurricanes, typhoons, tornados, windstorms, and other tropical storms. A cyclone is a meteorological term for a large scale air mass that rotates around an active center of low atmospheric pressure. Most occur in the Indian Ocean, north-west Australia, or around east Africa. In the northern areas of the world, cyclones occur between June and November. The highest concentration of tornadoes is in September every year.
It’s a strong storm that brings winds, rain and even tornadoes, significantly affecting densely populated areas. Interestingly, the top ten countries listed by the National Oceanic and Atmospheric Administration for hurricane strikes since 1970 are the following: United States, China, Philippines, Mexico, Japan, Cuba, Australia, Bahamas, Vietnam, and Madagascar. These countries have sustained the most direct impacts of these types of storms.
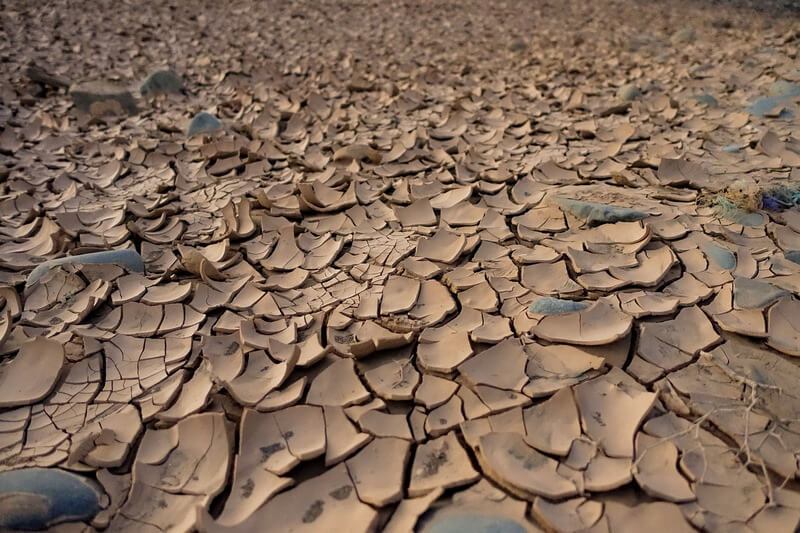
Famines
Although I would not call it a natural disaster type outright, I see famines in today’s world as a result of food instability caused by political and environmental factors. Scarcities in food availability represent a length of time accompanied by food shortages brought on by drought or other natural calamities — periods of famine from flooding was a regular occurrence throughout the history of humankind.
Although statistics indicate that famine events are less frequent than they have been in the past, they are still a concern for many areas across the globe. Nevertheless, the parts of the world that continue to be at risk of famine represent a much more limited geographic area than in previous eras, and those famines that have occurred recently have typically been far less deadly (source, Our World in Data). Access to better data sets is making it easier to share a clearer picture of famine events.
Characterized by undernutrition, famines have two major components. The first is a lack of protein availability that primarily impacts the development of children. The second cause of malnutrition is a lack of access to sufficient vitamins and minerals needed for maintaining overall health. Both of these deficiencies in access to essential food sources impact the ability to maintain weight and hinder growth (especially in children).
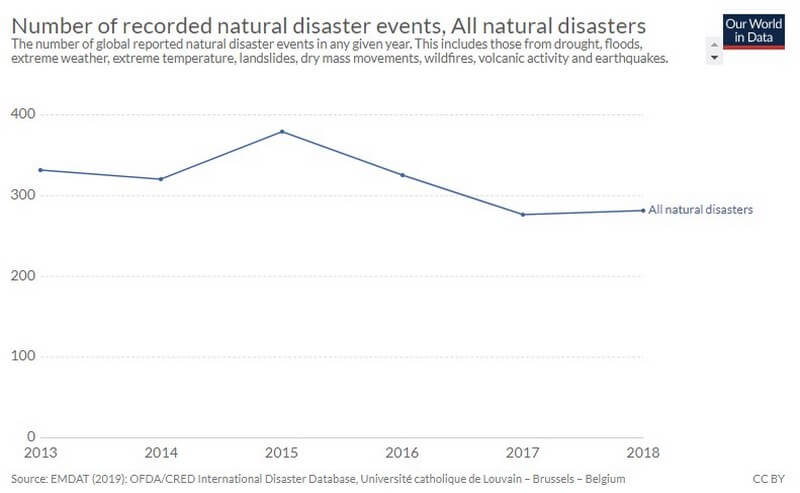
So What Does the Data Tell Us?
The thing to notice from the chart above is that it shows a decrease in incidents since 2014 (source, Our Word in Data). This data is good news! Hopefully, the downward trend continues.
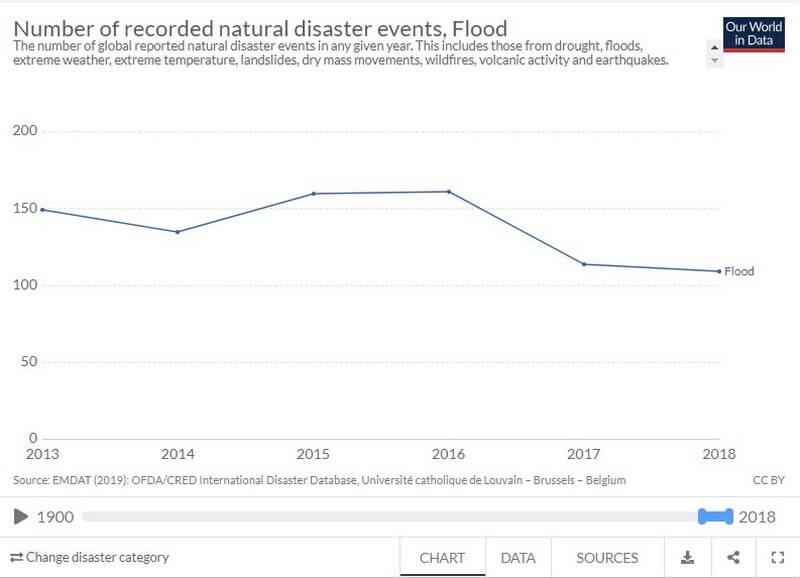
Flooding over the past five years
The number of floods remained relatively steady, dropping from 2013 to 2014 only to surge again for two years. It’s good to see that the number of events dipped from 2016 through 2018. It’s still a significant hazard event across the world, but it is always heartening to see a downward trend in the number of floods, especially since it is the most impactful worldwide.
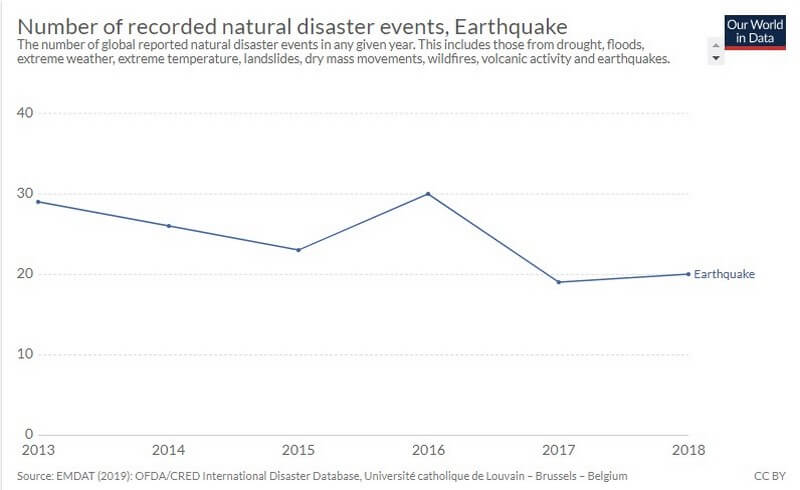
Earthquakes over the past five years
Between 19 to 30 earthquake disasters happened over the past five years. The worst year in this dataset was 2016 when 30 events occurred. Overall, the data show us that between 20- 30 major earthquake events happen across the globe each year. Additional data shows that earthquakes have caused the largest number of deaths globally during this decade (source, Natural Disasters – Our World in Data).
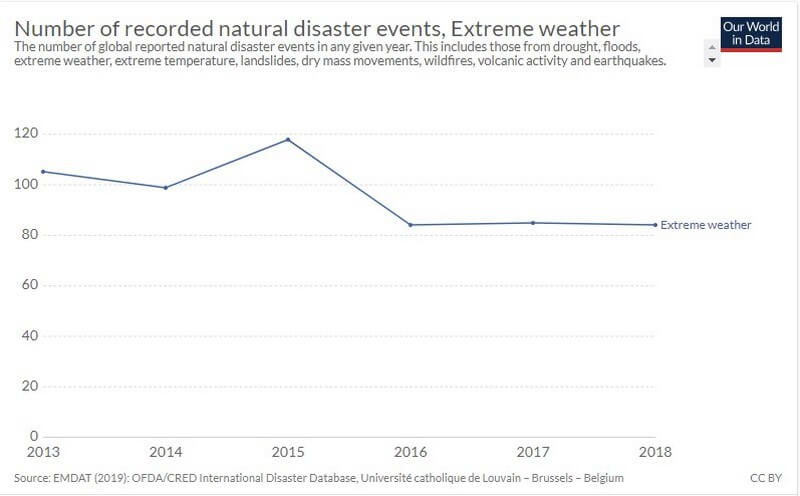
Cyclones over the past five years
Recent statistics indicate more Category 4 and 5 Cyclone events happening over the past few decades. There are approximately six major hurricanes on average annually that impact the United States alone. Across the entire world since the year 1900, tropical cyclones have incurred the loss of more than 874,000 human lives and more than 179 billion dollars in property damage (source, Ocean-Find Your Blue, Smithsonian). This chart from Our World in Data displays various extreme weather events over the past five years., with over 120 recorded in 2015 and 80 over the past three years. Some data suggests that the impacts from hurricanes, cyclones, and typhoons are increasing because they drop more rain and are moving more slowly when they make landfall (source, Nature-International Journal of Science).
Famine over the past five years
After the Industrial Revolution, the occurrence of famines has declined overall. The data suggests that the incidents of starvation and extreme hunger are more often a result of the political environment, exacerbated by significant changes in the climate and natural disaster events. Africa sees the highest number of famines by volume, where Asia has the most significant number of individuals who suffer from malnutrition (source, Worldhunger.org). Measured by the number of lives lost the top ten deadliest in history are: the Rajputana, India famine in 1869, Russian famine in 1601-1603, famine in Persia, Java under Japanese occupation during WWII, Bengal, India from 1769-1773, Soviet famine of 1932–1933, Chalisa Famine 1783-84 (Southern Asia), Chinese Famine 1959-1961, and the Persian famine of 1917-1918. To learn more, read The Deadliest Famines Ever on the World Atlas site.
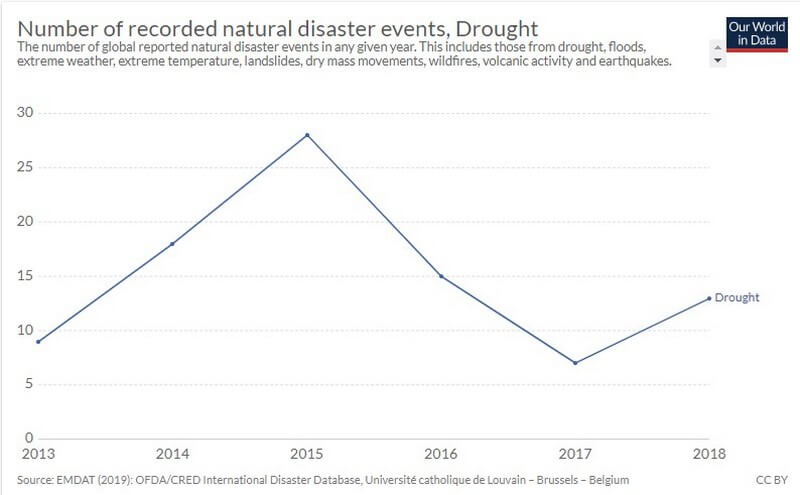
A peak of twenty-eight droughts occurred in 2015 over the past five years. Only seven happened in 2107, but the number climbed to thirteen in 2018. Although The United Nations estimated last year 25,000 people still die of hunger daily, not all of the statistic is directly related to famine. It will be interesting to see if the incidences of famines decline over time as countries develop across the world.
Natural disasters over the past five years
According to NOAA, the U.S. was already hit with two billion-dollar disasters so far in 2019. This snapshot shows us that between 300 – 400 disaster events are impacting us annually. Although I have chosen to view a small window in time, it is still insightful to take a look at recent trends. In a future article, I may contrast this data with more extended periods for comparison.
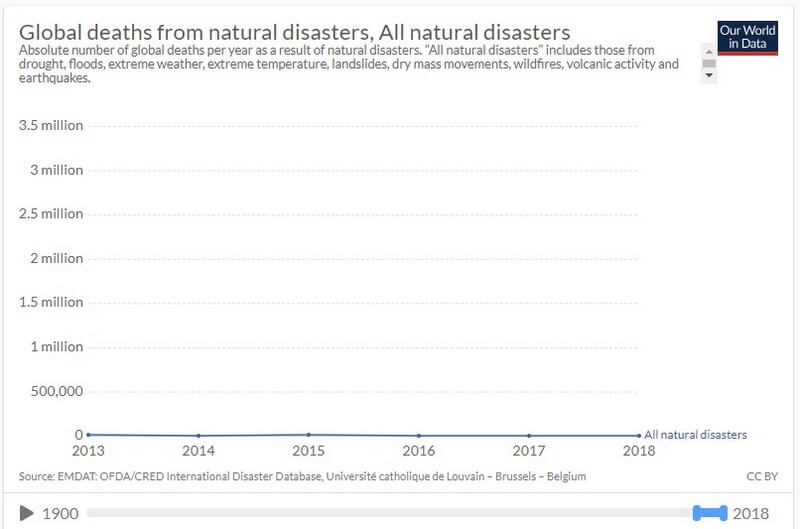
Over the past five years, the average number of deaths has ranged from a peak of 22, 861 in 2018 to a low of 7,341 in 2017. The total number of fatalities has decreased exponentially from this point a hundred years ago. In contrast, 3.71 billion died from natural disaster events in 1931. However, any death due to a disaster is too many.
Deaths are not the only impact from disasters, as they often result in injuries, homelessness, affected individuals needing life safety and economic assistance. Economic impacts have risen steadily over time. During the past five years, the events in 2016 had the most significant impact with a total estimated cost of $147.78 billion in US dollars. None of these statistics measure the human impact in terms of emotional distress.
In Summary
In summary, floods, famine, hurricanes, and earthquakes are some of the most frequent as well as devastating natural disasters that impact us annually. Few areas of the world are untouched by any of these events. And I did not even cover the effects of volcanoes, landslides, tornadoes wildfires or lightning strikes. In future blogs, I may cover ideas on how to mitigate the impact of these events and other natural disasters.
A review of over 100 years of the data seems to indicate that the frequency of disaster events is increasing. Regardless of the cause, the need for increased resilience to safeguard life, well-being, and infrastructure is clear. Finally, reviews like these call for increased education, information, access to technology and other resources to better prepare ourselves across the world to confront the challenges from natural disasters.